Data Graphics in Visio


Ming Sun / May 12, 2021
5 min read • ––– views
First let us create three cars from the car svg icons provided by Visio. Then right click those three cars and select Data => Define Shape Data... as shown below.

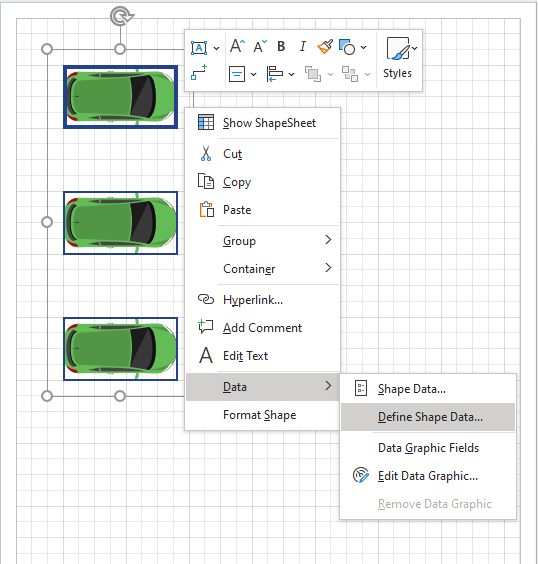
Then delete the predefined shape data by clicking the delete button.

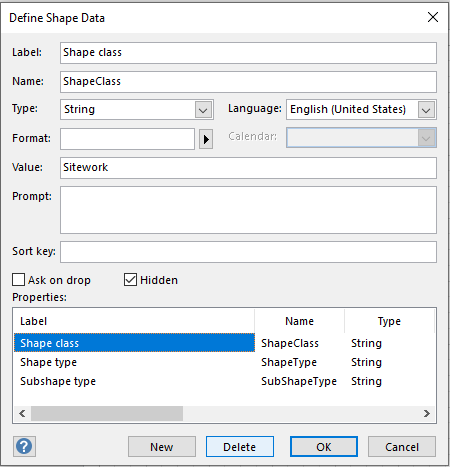
Define the new shape data template
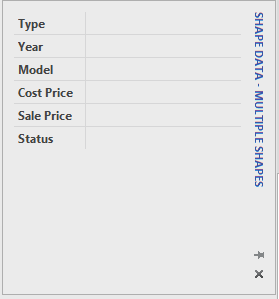
Next, let us define the shape data as follows:
- Type => string
- Year => string
- Model => string
- Cost Price => currency
- Sale Price => currency
- Status => string

Define shape data for each indivisual cars
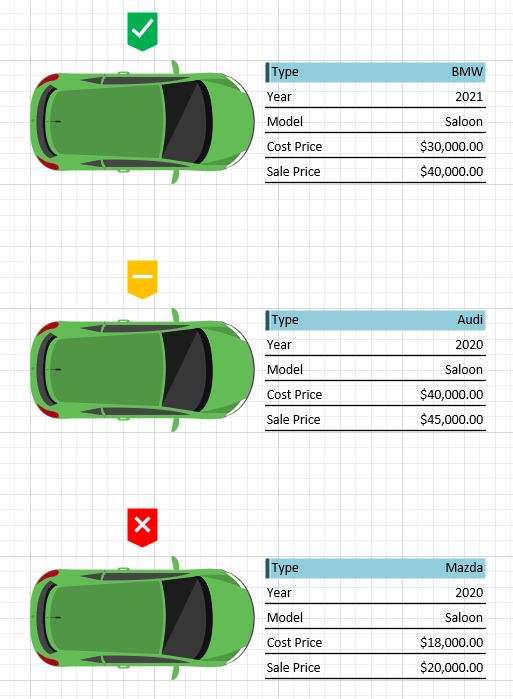
For the first car, the shape data is defined as follows:
- Type: BMW
- Year: 2021
- Model: Saloon
- Cost Price: $30,000
- Sale Price: $40,000
- Status: available
For the second car, the shape data is defined as:
- Type: Audi
- Year: 2020
- Model: Saloon
- Cost Price: $40,000
- Sale Price: $45,000
- Status: on offer
For the last one, we can defined the shape data as:
- Type: Mazda
- Year: 2020
- Model: Saloon
- Cost Price: $18,000
- Sale Price: $20,000
- Status: sold
Create new data graphics
Go to Data => Advanced Data Graphics to create the data graphics

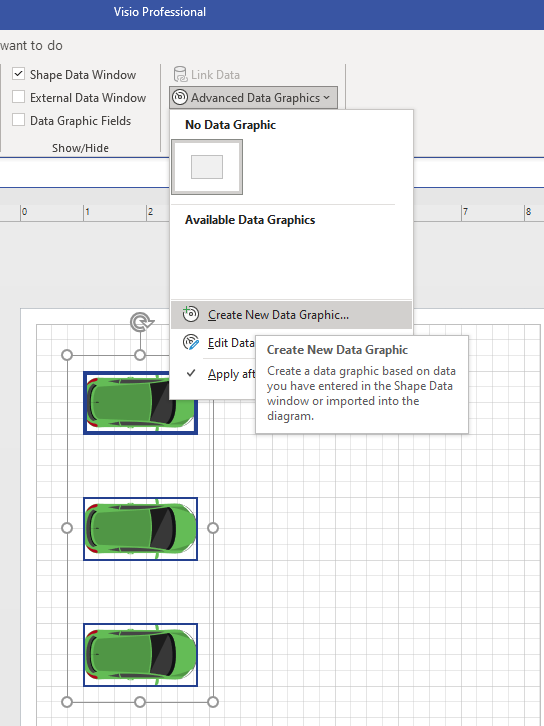
Add Type, Year, Model, Cost Price, Sale Price to the data graphics item as the text. For Status, let us define it as the Icon set so that we can show different icon based on each cars' status.


Finish
The final Visio drawing is as shown below. The data graphic shows the different information for each indivisual car. Based on their status, we show different icon above the car svg icon. Enjoy! 😄

Visio data graphics example file download
You can download the visio drawing from the link here